Human TNF R1/TNFRSF1A ELISA Kit
 Protocol Booklet
Key features and details
- Specification:
- Sensitivity:
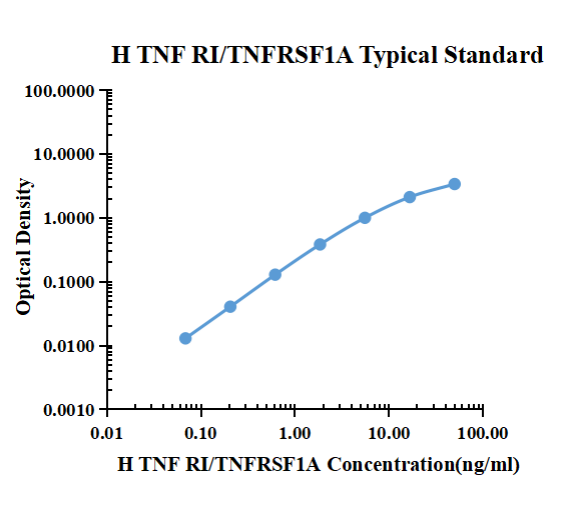
- Standard Curve Range:
- Standard Curve Gradient:
- Number of Incubations:
- Sample Volume:
- Assay type:
- Operation Duration:
-
Brand:

 Product Details

|
ng/ml |
O.D. |
Average |
Corrected |
|
|
0.00 |
0.0187 |
0.0199 |
0.0193 |
|
|
0.07 |
0.0329 |
0.0316 |
0.0323 |
0.0130 |
|
0.21 |
0.0593 |
0.0605 |
0.0599 |
0.0406 |
|
0.62 |
0.1474 |
0.1490 |
0.1482 |
0.1289 |
|
1.85 |
0.3976 |
0.4073 |
0.4025 |
0.3832 |
|
5.56 |
1.0320 |
1.0090 |
1.0205 |
1.0012 |
|
16.67 |
2.1240 |
2.1440 |
2.1340 |
2.1147 |
|
50.00 |
3.4340 |
3.3810 |
3.4075 |
3.3882 |
|
Intra-assay Precision |
Inter-assay Precision |
|||||
|
Sample Number |
S1 |
S2 |
S3 |
S1 |
S2 |
S3 |
|
22 |
22 |
22 |
6 |
6 |
6 |
|
|
Average(ng/ml) |
1.1 |
5.9 |
17.9 |
1.1 |
5.4 |
16.8 |
|
Standard deviation |
0.0 |
0.3 |
1.3 |
0.0 |
0.2 |
0.5 |
|
Coefficient of variation(%) |
4.1 |
5.7 |
7.0 |
3.9 |
3.1 |
2.9 |
- Intra-assay Precision (Precision within an assay) Three samples of known concentration were tested twenty times on one plate to assess intra-assay precision.
- Inter-assay Precision (Precision between assays)Three samples of known concentration were tested six times on one plate to assess intra-assay precision.
The spike recovery was evaluated by spiking 3 levels of human TNF RI/TNFRSF1A into health human serum sample. The un-spiked serum was used as blank in this experiment.
The recovery ranged from 96% to 128% with an overall mean recovery of 120%.
|
Sample Matrix |
Sample Evaluated |
Range (ng/ml) |
Detectable % |
Mean of Detectable (ng/ml) |
|
Serum |
30 |
2.4-5.14 |
100 |
3.87 |
Serum/Plasma - Thirty samples from apparently healthy volunteers were evaluated forthe presence of human TNF RI/TNFRSF1A in this assay. No medical histories were available for the donors.
New Products